Crystal Reports - Summary Data Report
Crystal Report - Summarized Financial Data
This article describes how to create a custom Crystal Report without using the Wizard. The report will use a Group to summarize financial data within the report. The data source used will be a custom view created on SQL Server database AdventureWorks. The report will be added as the report source to a CrystalReportViewer in an ASP .Net page.
Create the ASP .Net Web Application for Crystal Reports
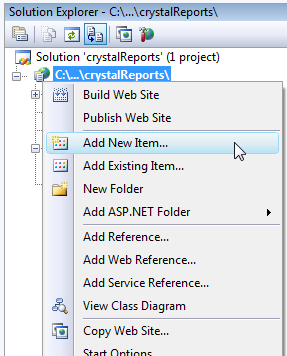
Create a new WebSite in VisualStudio. Add a new item (Crystal Report) to the project.
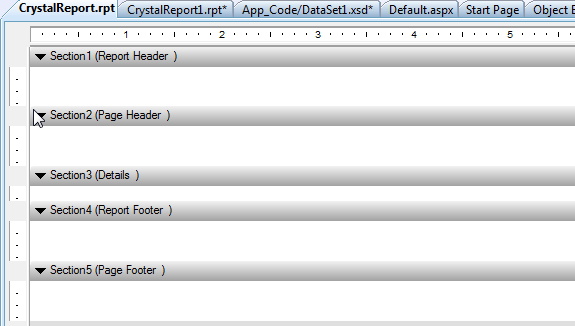
The blank report is not connected to a datasource.
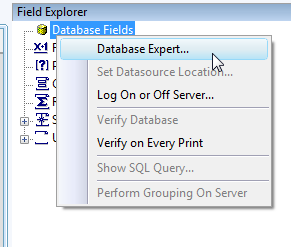
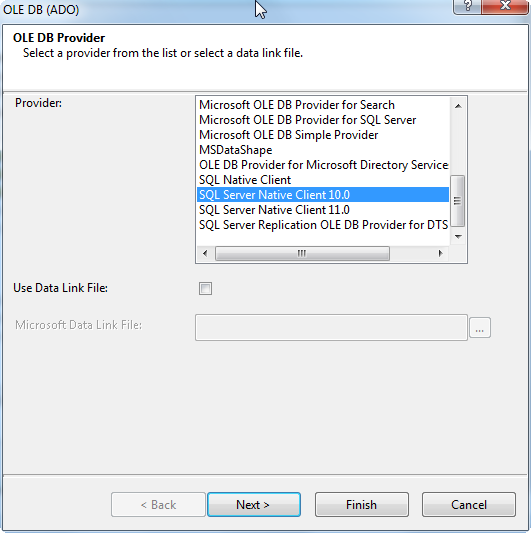
To connect to the datasource, open the Database Expert.
This report will use SQL Server 2008, so the Provider selected is SQL Server Native Client 10.0. Click Next and select the Server and Database Name to Finish.
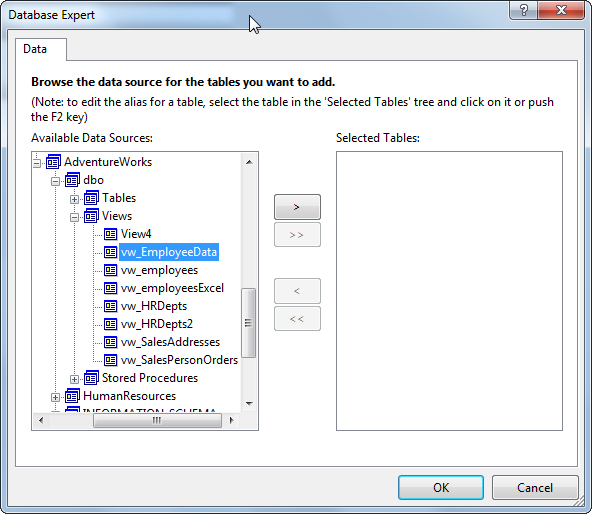
Select the table or view to use. This report will use the custom view vw_EmployeeData for the Data Source
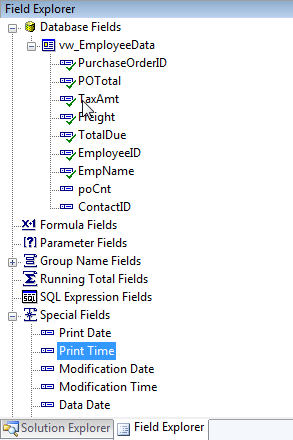
Select the Fields from the Field Explorer and drag and drop them onto the report.
Using Crystal Reports Group Expert to Summarize Data
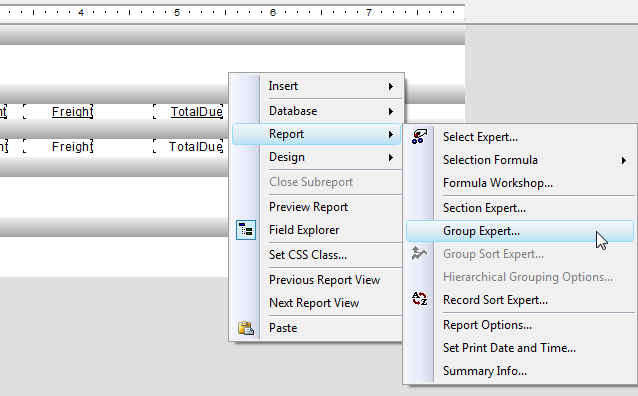
Right click on the report to open the Group Expert.
This summary report will group the sums of each of the columns by Employee ID. Click the EmployeeID field and press the Right Pointing Arrow (>) to send it to the GroupBy box.
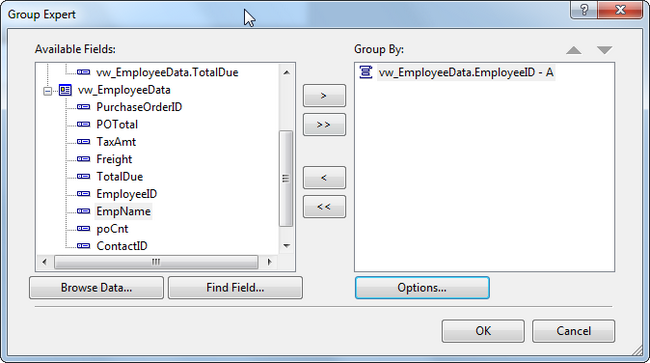
Add the Employee Name field to the group and format it to Bold in the Font toolbar.
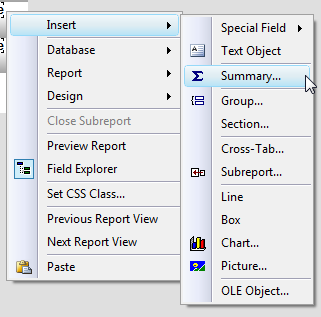
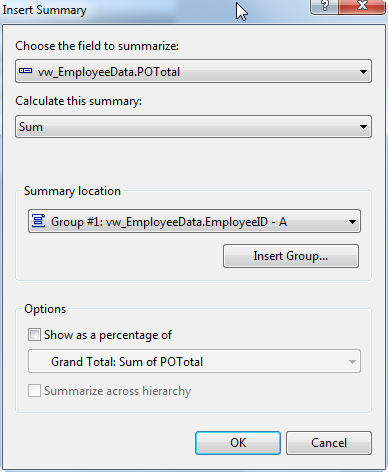
Right click on the report to select Insert then Summary.
Select each one of the currency fields from the drop down below the text "Choose the field to summarize" and select the Summary location as the Group #1 EmployeeID.
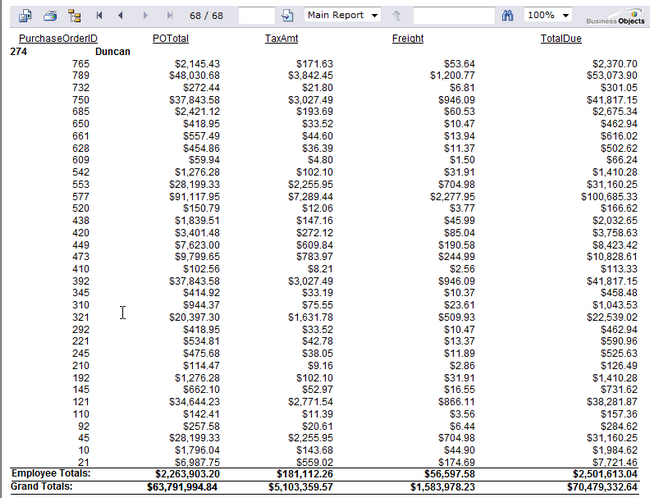
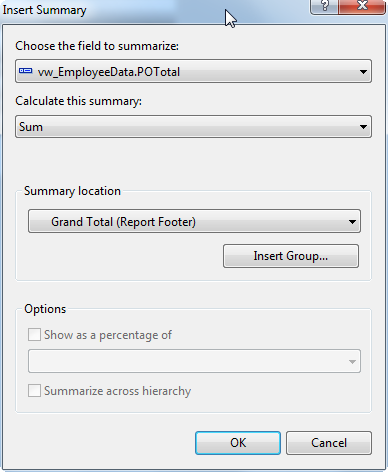
Repeat the Insert Summary tasks for each one of the Currency fields using a different Summary location: Grand Total (Report Footer).
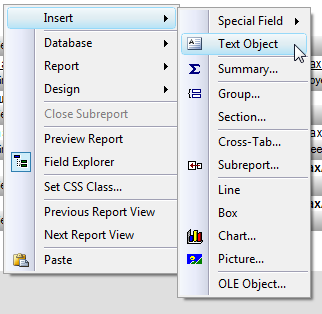
Right click and Insert a Text Object into the Report Header to Name the report.
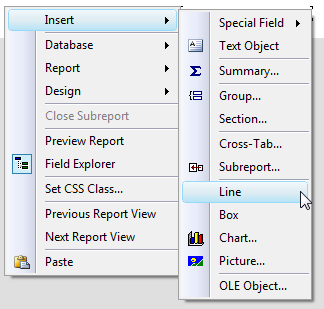
Right click and Insert a Line above and below the Grand Totals and Employee Totals Group.
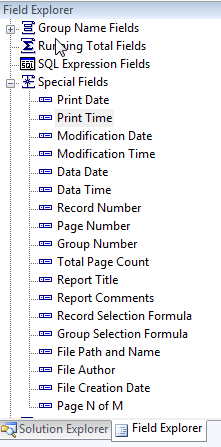
Open the Special Fields in the Field Explorer to add the Print Date and Page N of M fields to the report.
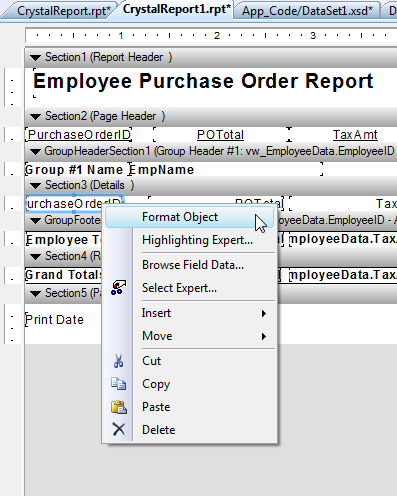
Right click on the report to Format the PurchaseOrderID object.
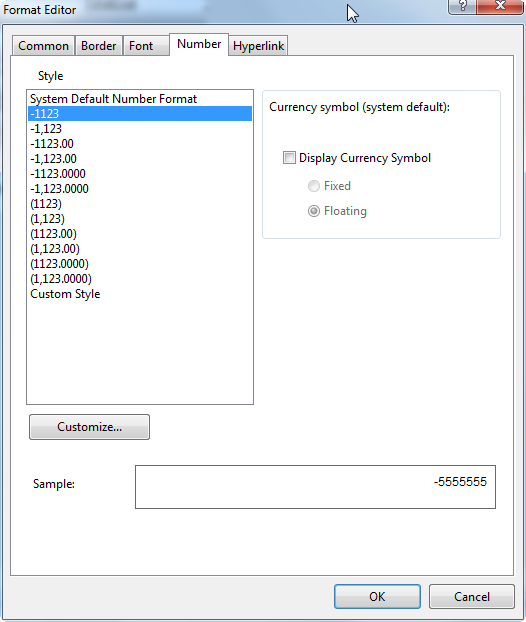
To remove the 1,000's separator, select the first number format in the Style box in the Number tab.
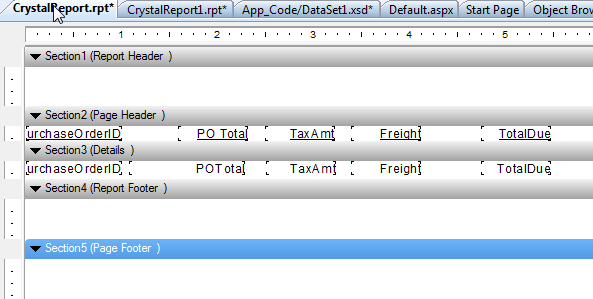
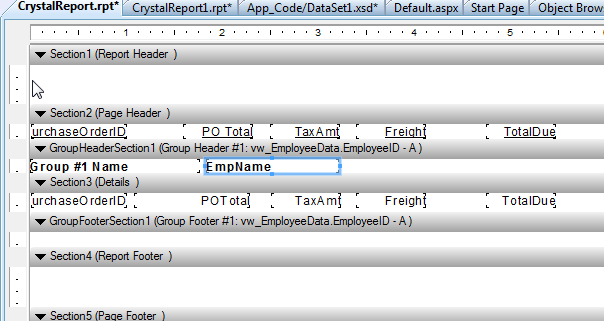
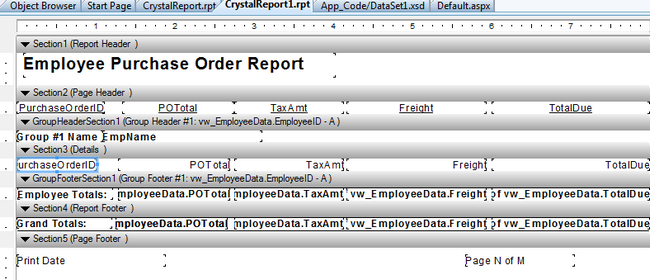
Design View of formatted Report.
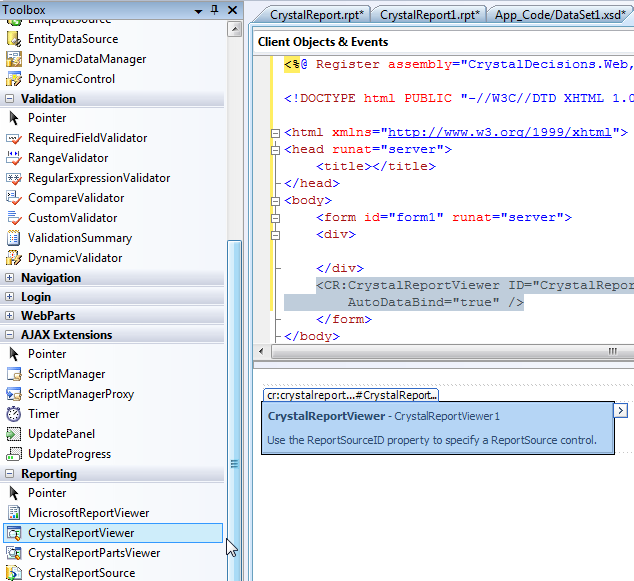
Open the Default.aspx page to drag and drop a CrystalReportViewer onto the page.
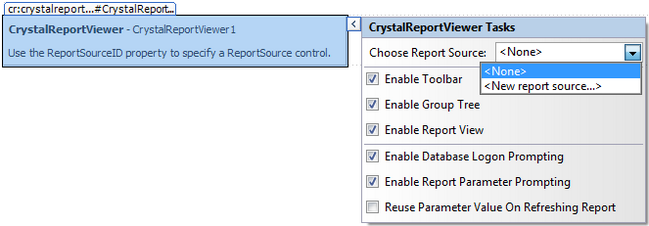
Add a New report source to the viewer.
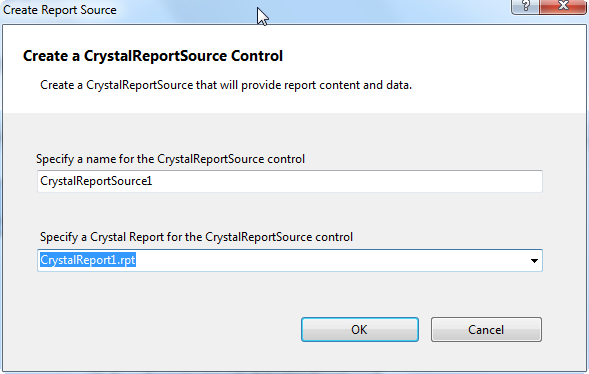
Select the existing Crystal Report from the Project.
Click debug in Visual Studio to Preview the report in the web page.
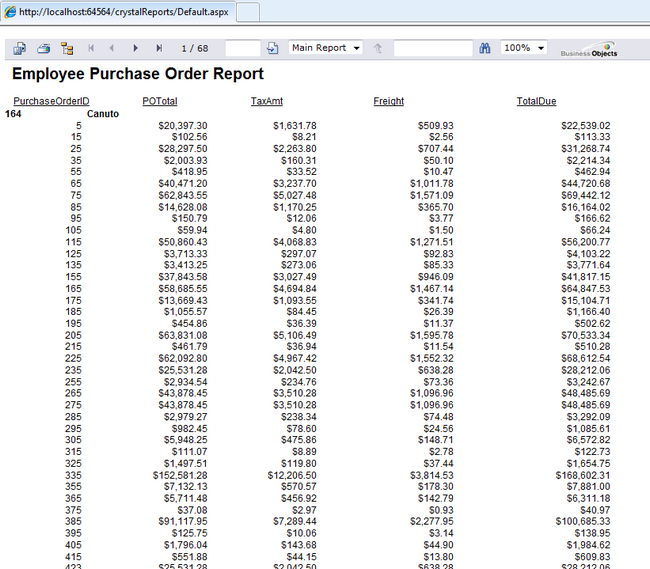
Click to get to the last page of the report to verify the totals appear with the correct format.