SSRS Composite Report
Using Grouping in an SSRS Composite Report with Single Dataset
This article describes how to use grouping to create a composite report of Vendors and Purchase Order data using 1 Dataset. The issue with the View that will be created is that for each Vendor there will be multiple rows of Purchase Order data. I only want the Vendor data to display 1 time for each vendor and then provide a list of the POs, Order Dates, etc. below each Vendor Name and Account. In Crystal Reports, I would use separate subreports and link them together with the Vendor ID from each one. This SSRS Report will use only 1 Vendor report with a List object that contains a Rectangle object and a Table object to get the job done.
Creating the MultiRow View in SSMS
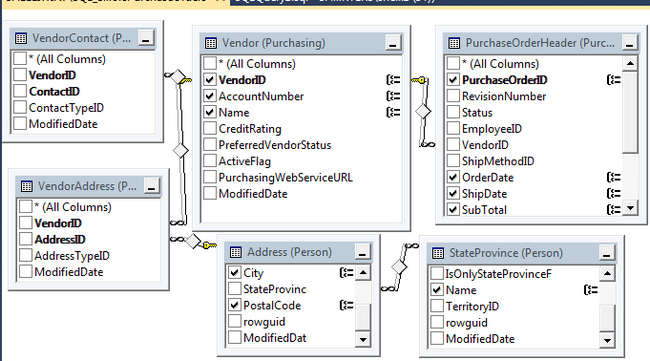
Open up SSMS and create a new view in the AdventureWorks Database. This one uses the Design View and "Drag and Drop" of the tables to create this View.
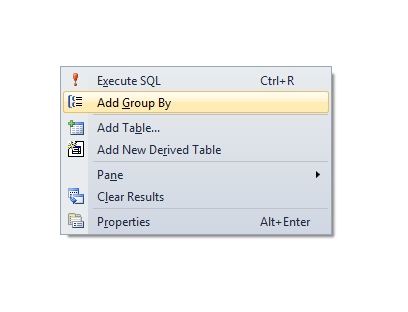
Click in the Menu bar on the Group By button or Right Click in the Design area for the View and click on Group By.
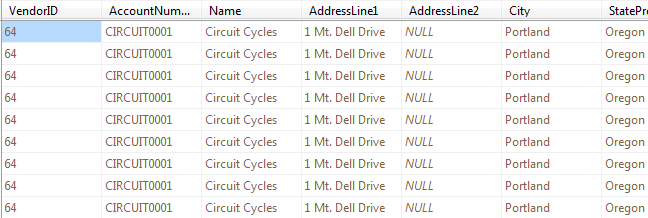
For each row of the View the Vendor appears multiple times.
SSRS Project in Visual Studio
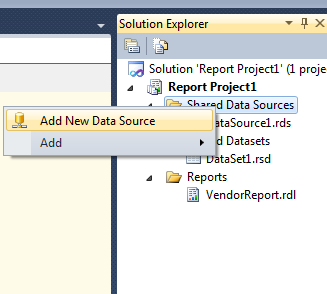
SQL Server 2012 Developer Edition ships with SQL Server Data Tools in VS 2010. Open a new Report Server Project. In the Solution Explorer, right click on the Shared Data Sourc folder and click Add New Data Source.
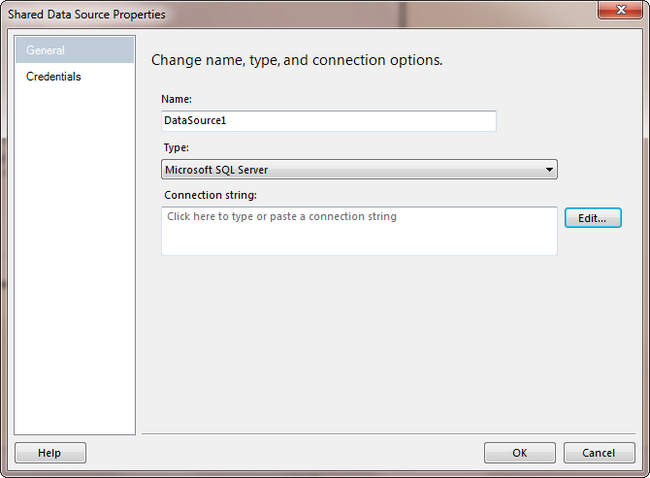
The pop up to set the Shared Data Source will appear. Make sure Microsoft SQL Server is set as the Type and click on the Edit button to set up the Connection to the SQL Server and the AdventureWorks database.
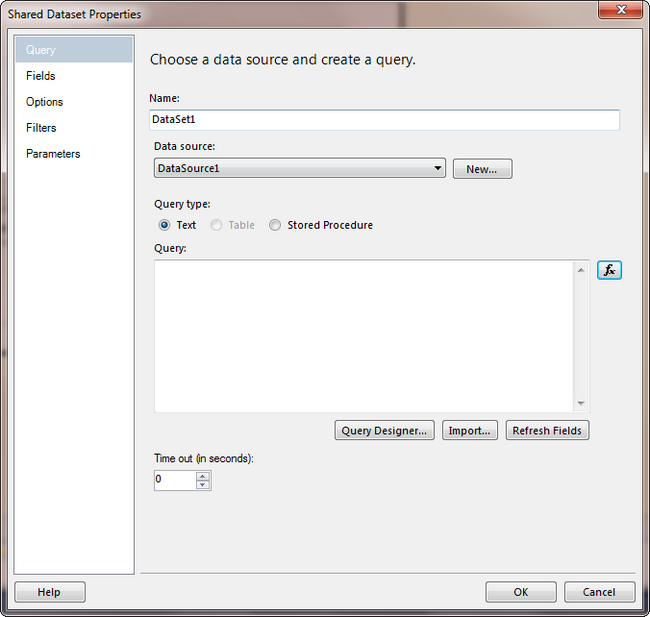
Right click on the Shared Datasets and click Add new Dataset. The pop up will appear to set the Table, View, Function for the data. Click on the Query Designer button.
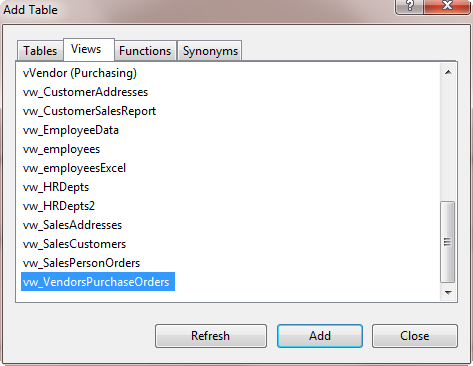
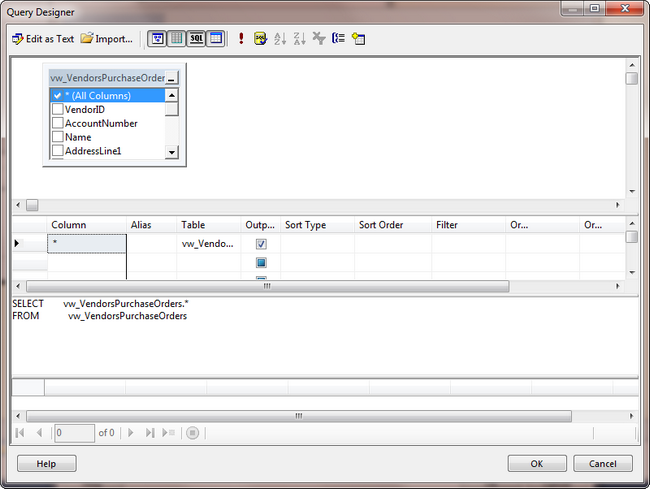
Click the button in the menu bar with a Grid and Plus sign on the far right to select the View created earlier and then click the checkbox next to *(All columns).
Creating the Report
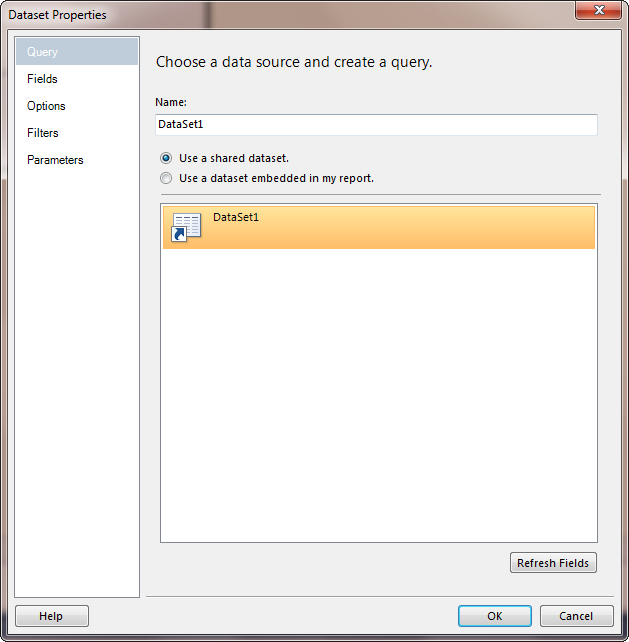
Right click on Reports, click Add, Add New Item to prevent the Report Wizard from popping up. Select Report Project and click OK. When the blank report appears, Right Click in the Datasets folder under the Report Data Properties box and click Add New Dataset. The pop up appears. From here, you can select Use a shared dataset and select the Dataset created in the Shared Dataset folder in Solution Explorer.
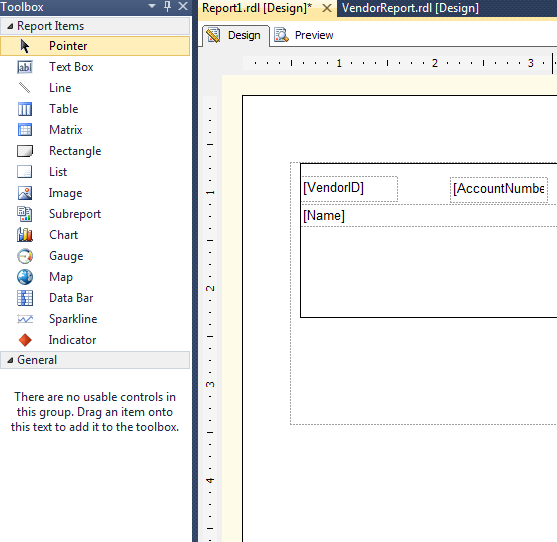
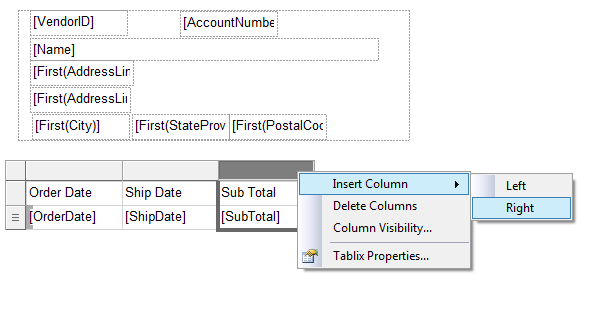
From the Toolbox, drag and drop a List item on the report and a Rectangle object inside of the List object and then go back to Report Data and drag and drop the Vendor information that will appear only 1 time for each Vendor into the List object. I right clicked in the Rectangle to get to the Border property and added a Solid black 1 pt line to make it more visible.
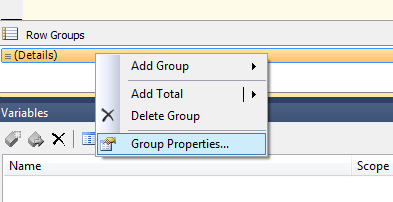
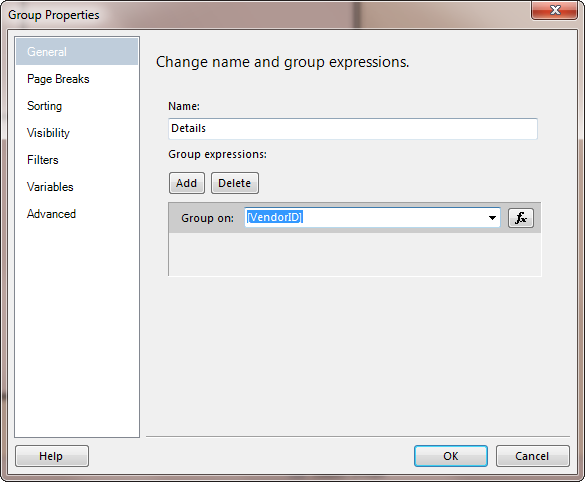
Click in the Row Groups section of the report and right click Group Properties and then in the pop up under Group Expressions click the Add button and select VendorID from the drop down to group the results be Vendor ID.
Drag and drop a Table item from the Toolbox on to the report inside of the List object and then select the fields from the drop down area (2nd row) of the table. You can right click on the last column to Insert Columns to the Left or Right. Add all of the Purchase Order data into the report. While still on the Table object, return to the Row Group section and right click on Details1 and select Group Properties to Add the Group OrderDate and Sort of OrderDate.
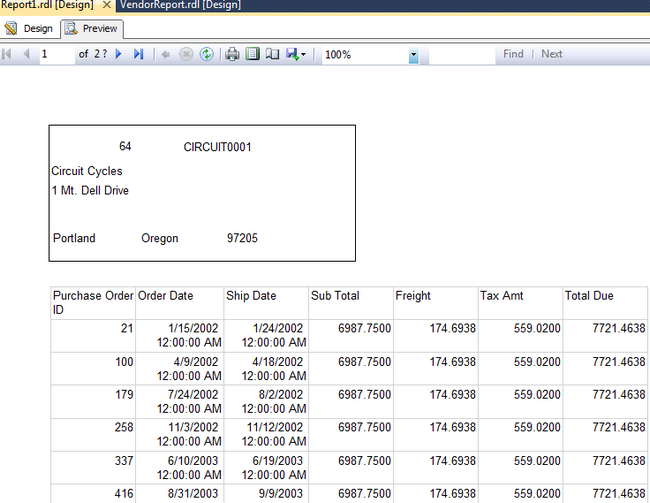
By clicking on Preview, you can see that the data appears on the report with 1 Vendor and their related Purchase Order data since both the Rectangle object and the Table object are contained within the List object which groups by VendorID. However, the formatting of dates, amounts, the Vendor address, the VendorID & Acct are needed. Also, a Row Number would be nice so we could see how many orders there were for each vendor.
SSRS Expressions
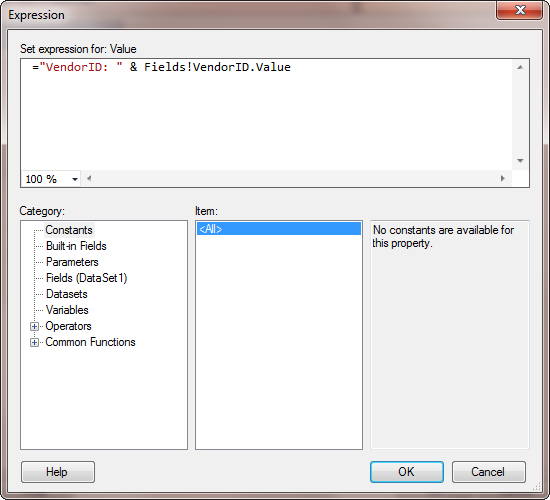
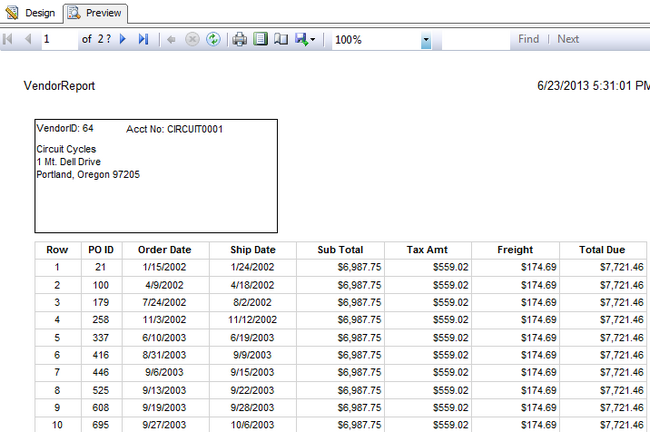
I modified the size of the font and the size of the TextBoxes to be smaller. I also added a couple of Built-In items to the Report Header - The Report Name and ExecutionTime. I changed the Vendor ID to an Expression to make it more obvious as to what the number in the report was there for as well as the Account Number field.
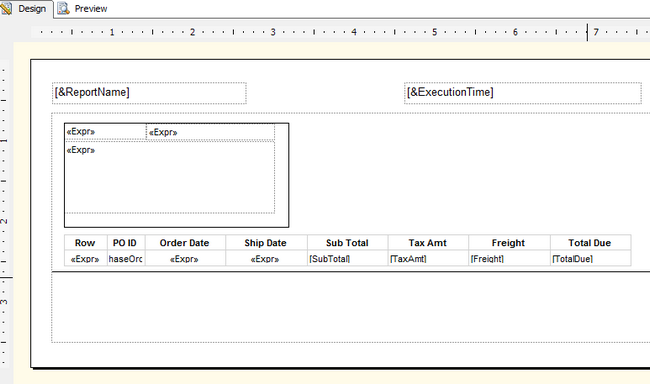
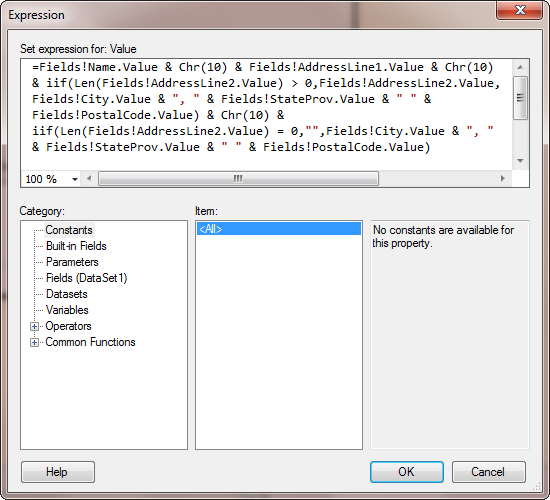
I removed the individual TextBoxes for the Name and Address fields and concatenated them into a single string expression. I am using Chr(10) to cause a Line Break for each line and 2 IIF statements in case the AddressLine2 value is null. I don't want a blank line between the Name and Address and the City State and Zip and I don't want the City State and Zip to repeat if I already replaced it as AddressLine2. I also put the City, State and Zip together with the appropriate comma separating the City and State and a space between the State and Zip.
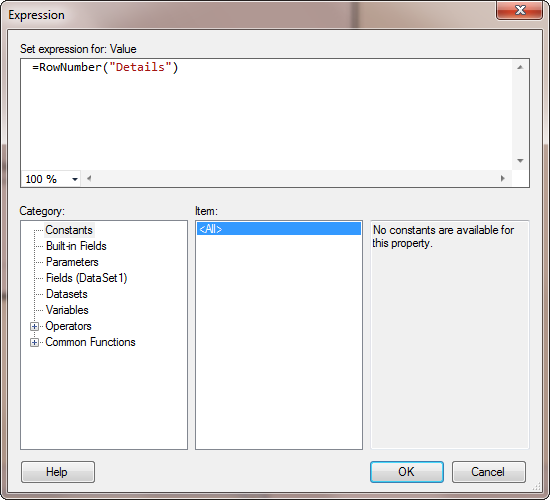
I also added a RowNumber column using the Details Grouping for the List object to force the RowNumber to start from 1 again for each Vendor.
SSRS Formatting
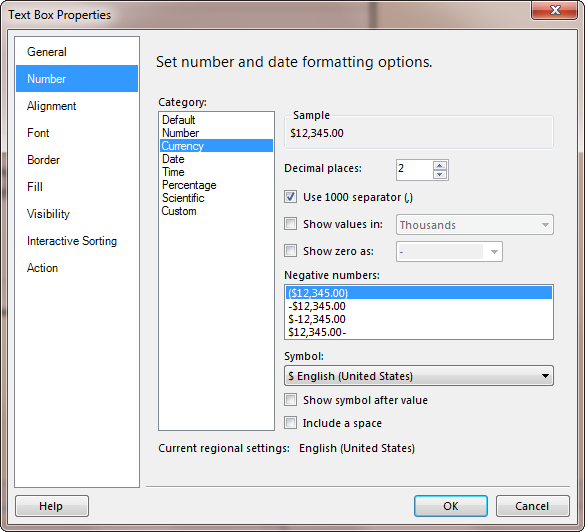
For the amount fields in the table object, I right clicked each TextBox and went to TextBox Properties and selected Number and changed it to the Currency Category and clicked the Use 1000 separator box to make them look nicer.
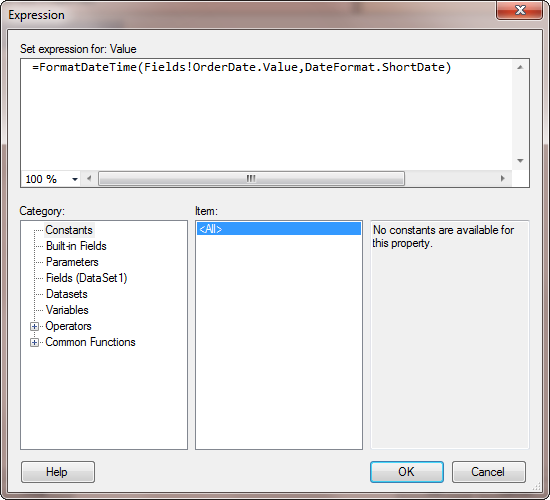
For the Date fields, I changed them both to Expression and used the FormatDateTime function with the DateFormat.ShortDate option.
The Final Report has a much better presentation with the additional formatting and expressions added.
Additional SSRS Notes
An alternate solution to the RowNumber addition in the Orders table could have been implemented in the View by adding the SELECT statement code:
Row_Number() OVER (PARTITION BY Purchasing.Vendor.Name ORDER BY Purchasing.PurchaseOrderHeader.OrderDate DESC) AS RowNum
This would have produced the same result that was created in the report by adding the Expression in the 1st TextBox.
