Excel Mini-Course in 4 Minutes
Each of these short video tutorials covers an essential skill needed to make simple Excel budgets and charts.
You can watch all the videos to see how to create a budget and chart from start to finish or just watch the ones you need. Expand videos to full screen mode for better viewing.
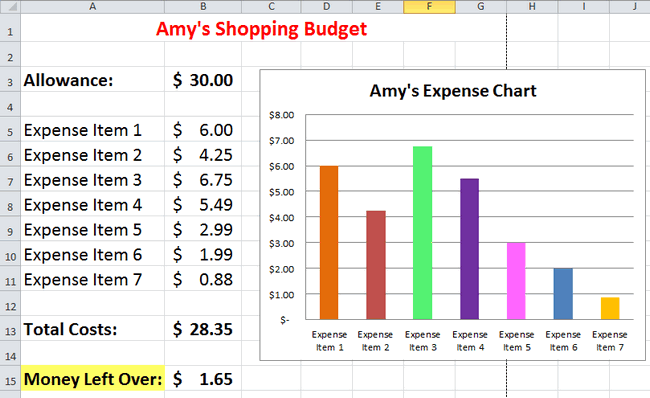
Example Budget Spreadsheet
& Chart you can Make with These Tutorials:
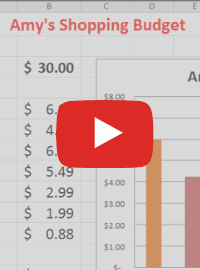
- First, type a title at the top, (Amy's Shopping Budget).
- Then type your data in column A: (Allowance, Expense items).
- Next, type your numbers in column B as shown below. No need to add dollar signs now, we'll do that later.
Excel Mini Course - Start Here:
1) How to Adjust Column Widths to Make More Room
Once all your data is entered, you may need to widen the columns to make room for long words or numbers. Here is how you do it.
Time to learn = 21 seconds
2) How to Merge and Center the Spreadsheet Title
Spread your title across several cells and merge all the cells into one while centering the title.
Time to learn = 11 seconds
3) How to Format the Budget Numbers with Dollar Signs
When you work with budgets, you need to change the numbers into the accounting format of currency.
Time to Learn = 16 seconds
4) How to Calculate the Total Expenses using Autosum
Budgets need to show the total amount of all money spent (expenses) with accuracy. Use autosum to calculate these totals.
Time to Learn = 18 seconds
5) How to Calculate Profit or Money Left Over
Budgets show how much money you had, how much you spent and how much is left over (profit), if any.
Time to Learn = 26 seconds
6) How to Create the Chart with Your Data and Numbers
Charts are visual aids to help you analyze numbers or trends. Create a chart showing your expenses to see where the money went.
Time to Learn = 27 seconds
7) Make Your Chart Look Better by Changing the Colors
Make your chart easier to read and more visually appealing by adding color to your charts.
Time to Learn = 1:11 seconds
8) Improve Your Chart with a New Layout and Design
Add titles and labels to your charts with a new layout or design.
Time to Learn = 40 seconds
