Excel Lesson Plan
Clothes Shopping Budget with Chart
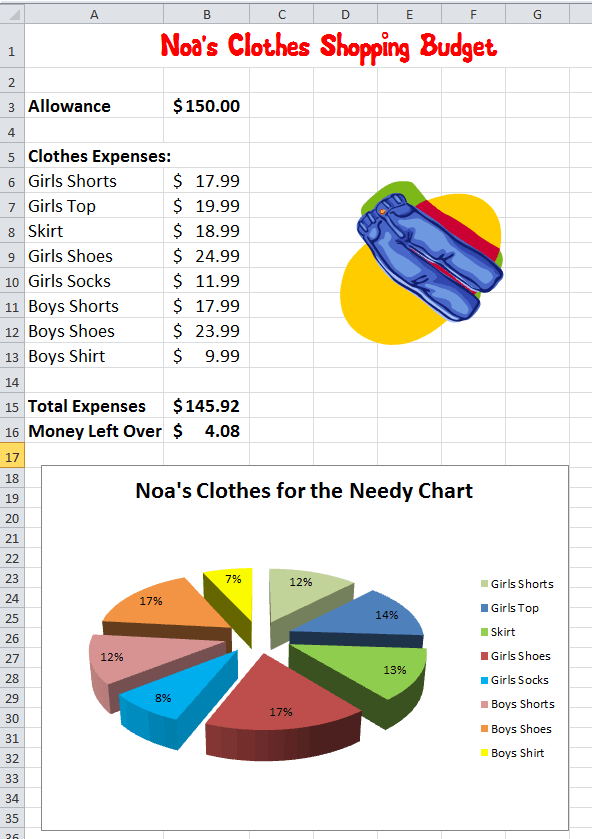
Assignment: Students create and format a clothes shopping budget with a chart. Students use a shopping list to select clothing items to purchase and donate to needy children. Students have a gift card allowance of $150.00 to spend. Students purchase as much as they can for one girl and one boy without going over the $150.00 budget. Students enter their chosen clothing items and costs in a spreadsheet.
Students use the sum function to calculate total expenses from a column of values (clothing expenses).
This lesson builds on the basic expense budget lessons by adding the following requirement:
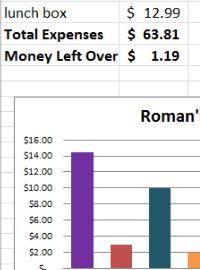
Students use a simple formula to calculate money left over (allowance - total expenses = money left over).
Download: clothes-shopping-budget-chart-example.xlsx
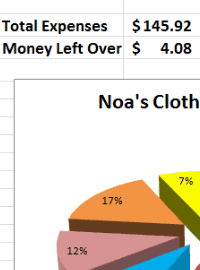
Excel Shopping Budget
with Chart Finished Example:
Download: excel-clothes-shopping-price-list.pdf
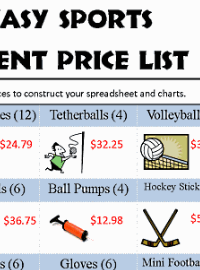
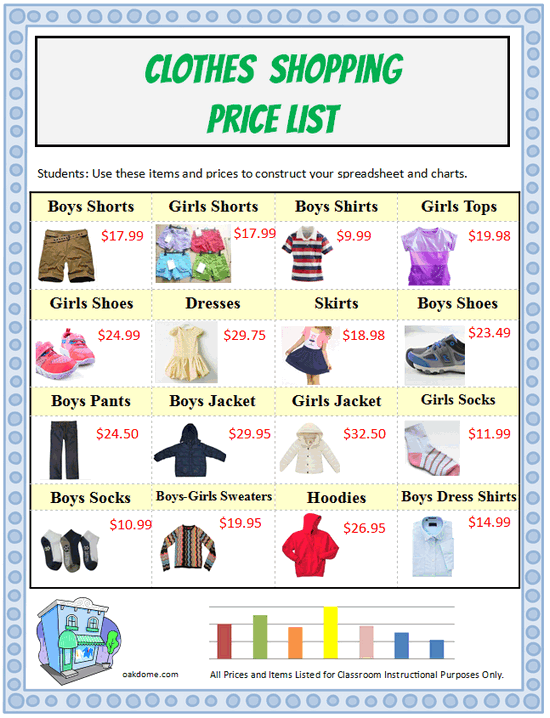
Clothes Shopping Price List:
Students choose items from this list for their spreadsheet entries.
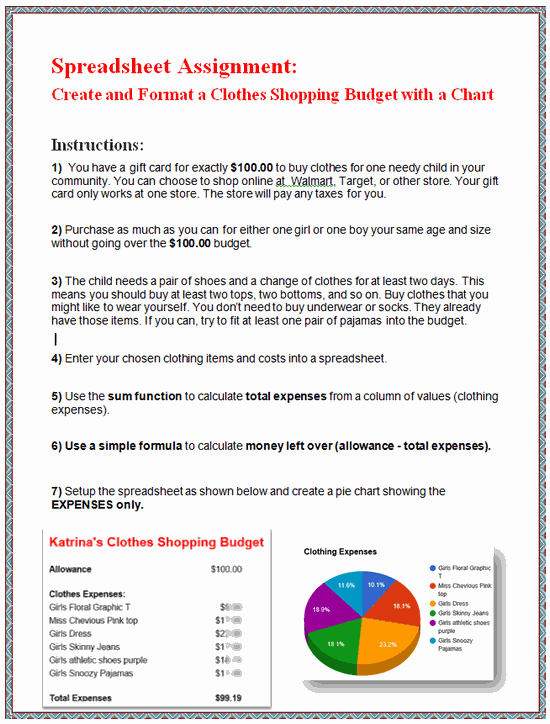
Download: student-instructions-clothes-shopping-budget-with-online-price-research.docx
Student Instructions with Online Research
These are instructions for students to create the clothes shopping budget using real world pricing found online. These instructions are for upper primary grades. Students tend to really love this version as they are able to comparison price shop their favorite stores online.
Excel Mini-Course in 4 Minutes:

Quickly learn the essentials you need for this lesson with these short, focused video tutorials. Watch all the videos to see how to create a budget and chart from start to finish or just watch the ones you need.
Students Learn and Practice
the Following Basic Spreadsheet Skills:
- Creating and formatting a spreadsheet title using "merge and center"
- Entering data in columns and rows
- Using the simple formula "Autosum" to automatically calculate total expenses
- Using a subtraction formula to calculate money left over (allowance - total expenses)
- Formatting numbers as currency and adding $ signs.
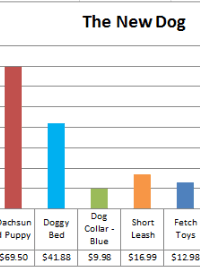
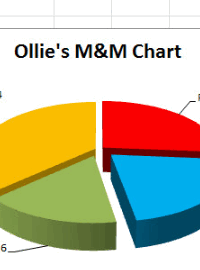
- Creating a chart using the expense data entered.
- Using different colors for chart segments to improve visual presentation
- Creating, sizing, and positioning the chart to fit on a single page with the data
- Searching, inserting, sizing, and positioning clipart or pictures
- Using print preview and printing
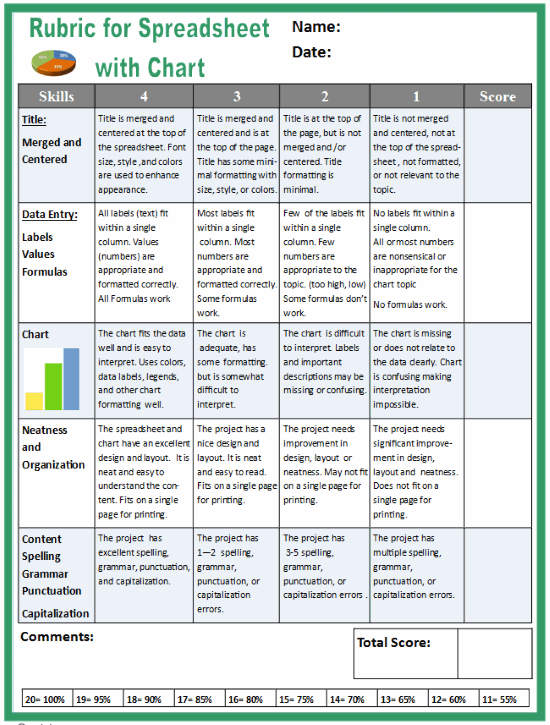
Download: rubric-for-spreadsheet-with-chart.pdf
Excel Spreadsheet Rubric for Grading Assignments
