iWork Numbers - M & M Pie Chart
Assignment: Students learn to create a simple pie chart to represent numerical values in a spreadsheet using iWorks Numbers. Students will learn to enter labels (colors) and values (numbers) into cells. Students will learn how to select the data they have entered and choose a pie chart to display the results. Students will learn to create a title for their chart data with their name (Kyla's M & M Chart). Students will learn to format the data and pie chart pieces for better visual appeal using larger fonts and appropriate colors.
Download: iwork-numbers-make-an-M&M-chart-tutorial.pdf
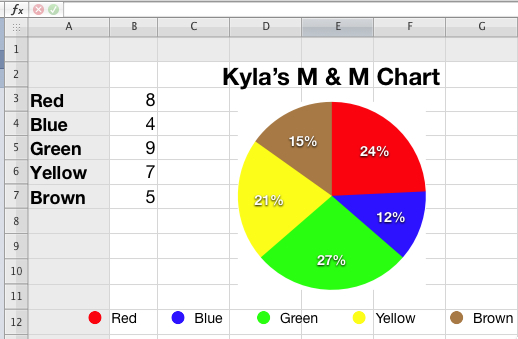
Finished M & M Pie chart Example
Students enter their text in one column, and enter their numbers in a separate column. Students select the text and numbers to create their chart. This chart is fun because students must color the chart pieces to match their M & M colors.
Create an M&M Chart Tutorial